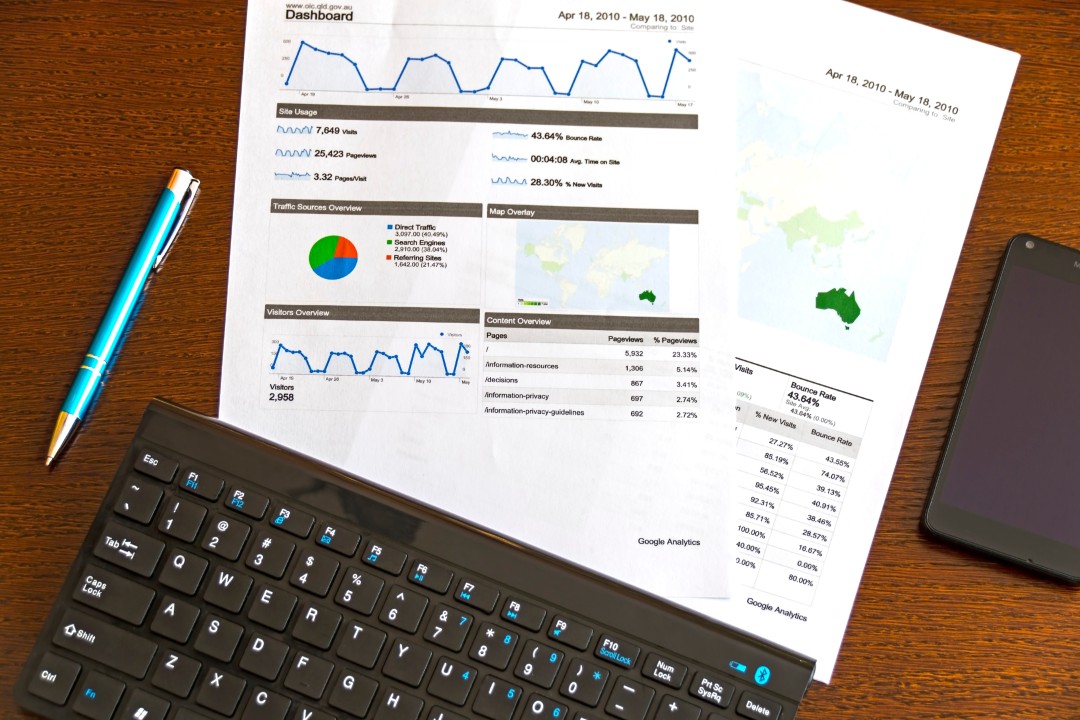
FP&A team works with all departments within the company on revenue / expense targets. They also provide guidance on how to stay on track with the overall plan. They do that by leveraging management reports.
The term “management report” is often used interchangeably with “management information system” (MIS). However, a management report is more focused on the executives and managers than on the technicalities.
In the modern business world, it is hard to keep track of everything that is going on. And management reports are essential for any type of organization to maintain transparency, make decisions, and understand the business better.

Here are different types of management reports that can be used for different purposes.
1. Month end Reporting
Here the latest month actual is compared against the Budget and the latest outlook (forecast) with variance analysis, commentary, and business recommendations.

2. Quarterly Business Reviews (QBR’s):
During quarterly business reviews, top management examines progress metrics.
This helps to identify adjustments that need to be made in the next quarter based on previous quarters’ performance.
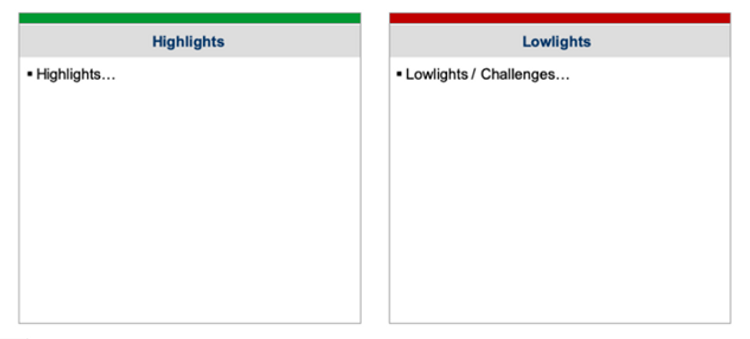
Here is a sample highlight v / s lowlights slide from the QBR deck
3. Operating Plan Deck (Budget Deck)
An operating budget is prepared in advance of a reporting period as a goal or plan. This is the target that the business expects to achieve in the next financial year.
4. Latest Estimate / Outlook Deck:
In this report the latest period forecast is updated and compared against the previous outlook and comments are made on what has changed from the previous outlook.
This is updated whenever we update the forecast.

5. Flash Reporting:
It is a periodic snapshot of key financial and operational data. Often, it is a one-page report that helps management assess the key performance indicators of the company.
Flash reports usually cover the shortest period that is feasible, usually on a weekly basis. They are short and succinct, and they give business leaders a snapshot of financial and operational affairs for a business unit, market segment, or product line within a given timeframe.
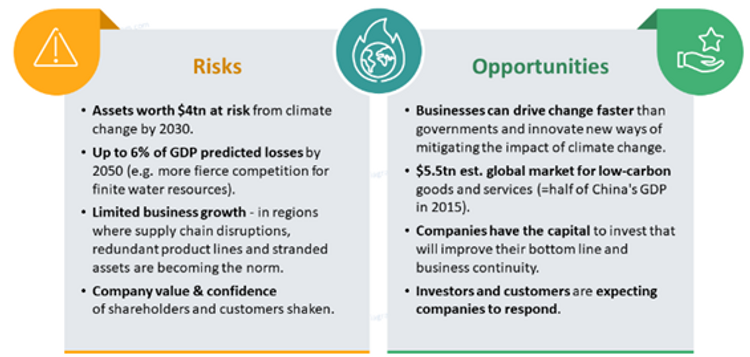
6. Risks and Opportunities Assessment
Risks can have a negative impact while opportunities can have a positive impact on the profitability, cash flows and financial position of any company.
In this report, all the risks and opportunities are listed along with the probability of its occurrence.
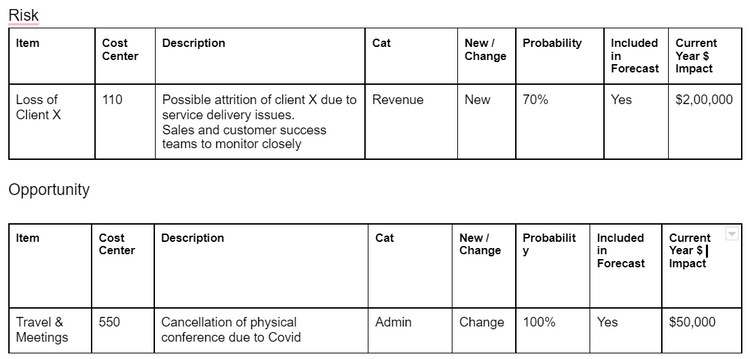
Here is an example of how it goes in the final presentation
7. Headcount / Manpower Reporting:

This is employee data presented in many ways. For example, by, Type of employment contract : permanent, fixed term or temporary, Job titles and positions. Full-time or part-time, transferred in or transferred out. Location, Age, Gender, Tenure.
8. Sales Pipeline Analysis:
Sales pipeline is a visual representation of a buyer’s journey. Through a sales pipeline, businesses get an idea of how close a prospect is to completing a purchase.
Sales Pipeline Analysis is done by analyzing the order book deals at various stages (Initiation, Negotiation, Lost, Closed etc.)
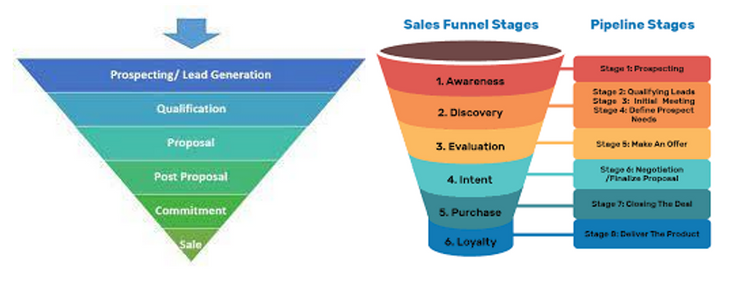
Pipeline Revenue is forecasted based on the deal stage and probability of conversion and is usually tracked with the help of a CRM tool.
9. Ad hoc reporting:
Ad hoc reports are one-time reports. They help senior management to answer critical business questions immediately using real-time data. And without the need to wait for standard analysis.
Ad hoc analysis is like ad hoc reporting. It is analysis that aims to answer specific business questions on an as-needed basis. But ad hoc analysis goes further, expanding on the objective data of a report to extract deeper insights. Ad hoc analysis helps connect more dots — not just what happened, but why.
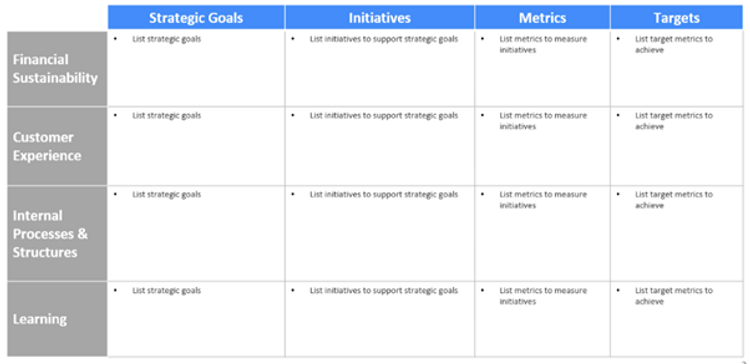
10. Balanced Scorecards:
A Balanced scorecard evaluates the performance of senior management not only through the finance perspective. It allows managers to look at the business from four important perspectives. From the perspectives of Customers, Processes (Internal Process), and Employees (Learning and Growth).
11. KPI or OKR Reviews

Key performance indicators (KPIs) refer to a set of quantifiable measurements used to gauge a company’s overall long-term performance.
Objectives and key results (OKR) is a goal-setting framework for defining and tracking objectives and their outcomes.
12 .Investor Presentations

Investors’ presentations are prepared for the earnings call, and they give analysts, current investors, and prospective investors a deeper dive into the company’s results, strategy, and culture.
It is generally a 10- to 25-slide presentation that tells the story of the company simply and compellingly to potential investors.
13. Monthly Product Reviews

Here we would sit down with the product teams to discuss progress on their plans and agree on actions to take to improve performance. This really helps everyone zoom in on key actions to take to meet or beat targets.
14. Product Profitability
This is an analysis and the process of linking a company’s overall profit back to the profit of a specific product.
15. Customer Segment reporting

Customer segmentation is the practice of dividing a customer base into groups of individuals that are similar in specific ways relevant to marketing, such as age, gender, interests, and spending habits.
Companies and organizations use customer segmentation analysis reports optimizing corporate decisions that are derived from deep customer analysis.
To summarize, here are the 15 different types of management reports we looked at
1. Month end Reporting
2. Quarterly Business Reviews (QBR)
3. Operating Plan Deck (Budget Deck)
4. The Latest Estimate/ Outlook Deck
5. Flash Reporting
6. Risks and Opportunities Assessment
7. Headcount / Manpower Reporting
8. Sales Pipeline Analysis
9. Ad hoc reporting
10. Investor Presentations
11. Balanced Scorecards
12. KPI’s and OKR’s
13. Monthly Product Reviews
14. Product Profitability Reporting
15. Customer Segmentation Reports
In conclusion, there are different types of management reports that can be used for different purposes. And management reports are essential for any type of organization to maintain transparency, make decisions, and understand the business better. You simply can’t manage what you can’t measure.
